

What 986 Solo Startups Actually Look Like
I analyzed the full TrustMRR database so you don't have to. The numbers are more honest, and more hopeful, than you'd have you believe.

Marc Lou built TrustMRR as a database of verified indie revenue.
Founders connect their Stripe accounts and the numbers show up live. It’s one of those ideas that sounds obvious in hindsight.
So I pulled the full dataset. 986 startups, scraped and cleaned, with fields covering MRR, profit margins, country, category, founder audience, pricing model, and more. Then I started running the numbers.
What I found is not what the timeline would have you believe. But before we get into the data, there are three things worth saying upfront — because they change how you should read everything that follows.
Three Layers of Bias (Read This First)
Layer 1: Marc Lou’s audience.
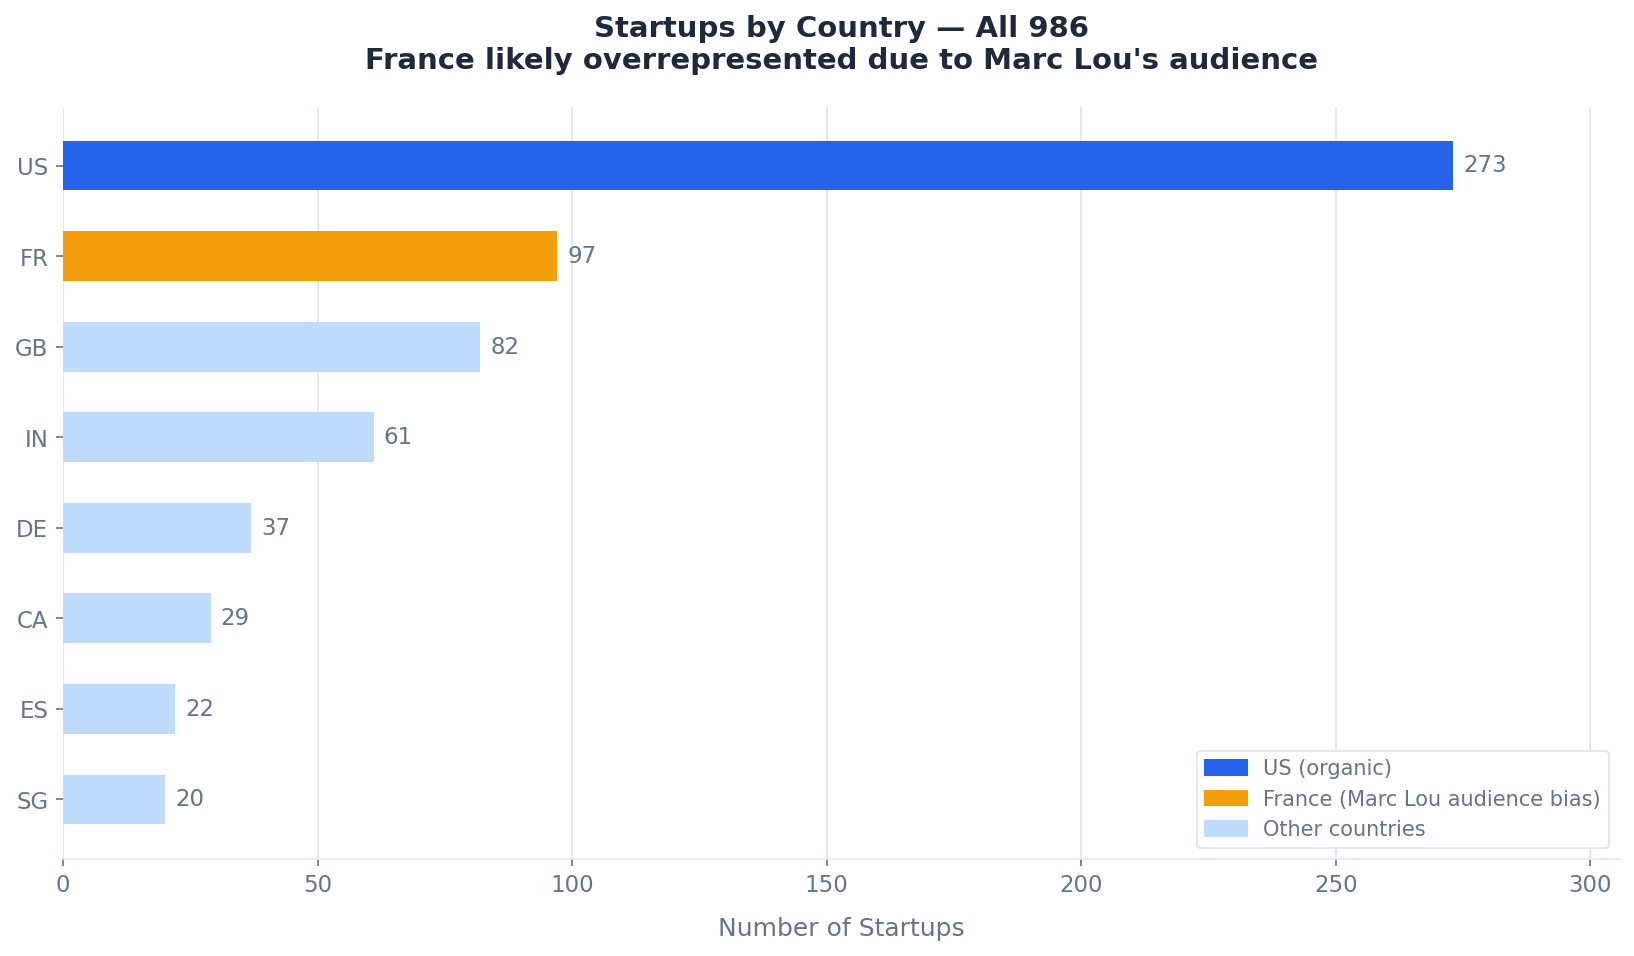
Marc Lou is French. And his audience is disproportionately French and European. This matters because TrustMRR's user base reflects his reach, not the global distribution of indie hackers. France is second in the database with 97 startups, behind only the US at 273. Marc himself tweeted about this dynamic when he ranked countries by revenue generated on TrustMRR — France punches well above its weight, which he celebrated. But it's worth keeping in mind as a systematic skew.
Layer 2: Self-selection for transparency.
The startups on TrustMRR are the ones whose founders cared enough about building in public to connect their Stripe accounts live. That's already a filtered group… more motivated, more community-oriented, more likely to be intentional builders. The true median indie hacker, including the person who tried something quietly for three months and got zero revenue, isn't here.
Layer 3: TrustMRR is also a startup marketplace.
This is the most underappreciated bias, and the one that changes the most about how you read the numbers. TrustMRR isn’t just a leaderboard. It’s a platform for buying and selling indie businesses. About 38% of the core projects are actively listed for sale.
Think about what that means. If you had a project growing 30% month-over-month, generating real income, and exciting you every morning, would you list it on an acquisition marketplace right now? Probably not. The projects that end up for sale tend to be the ones that have plateaued (decent revenue, but the founder has lost energy, or the growth has stalled, or they simply want to move on).
The data confirms this exactly. For-sale projects have a median MRR of $727, higher than the not-for-sale median of $319. But their average 30-day growth rate is just 119%, versus 651% for the projects not listed for sale. The plateau-ers get sold. The rockets get kept.
So the database you’re looking at is disproportionately populated by three kinds of projects: very early-stage startups, projects that have stagnated, and founders who joined the platform for community reasons rather than marketplace ones. The genuinely thriving, fast-growing projects are likely underrepresented.
With all of that in mind, here’s what the data actually shows, and what I think it really means.
The Real Picture
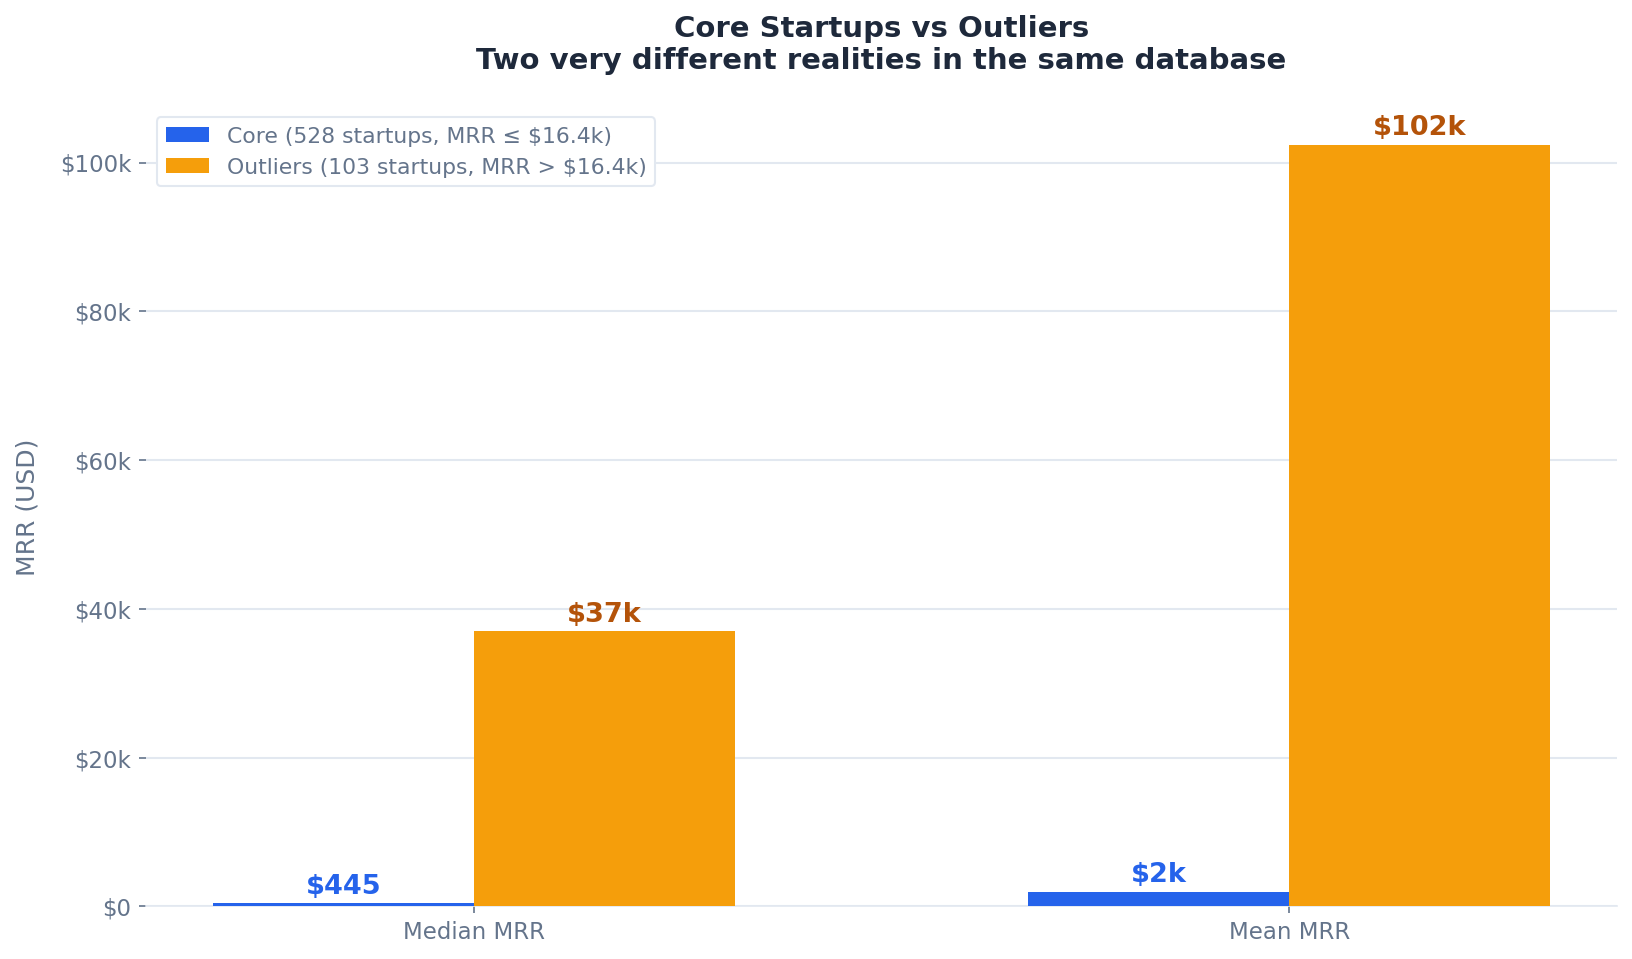
I split the dataset into two groups: a core and an outlier set.
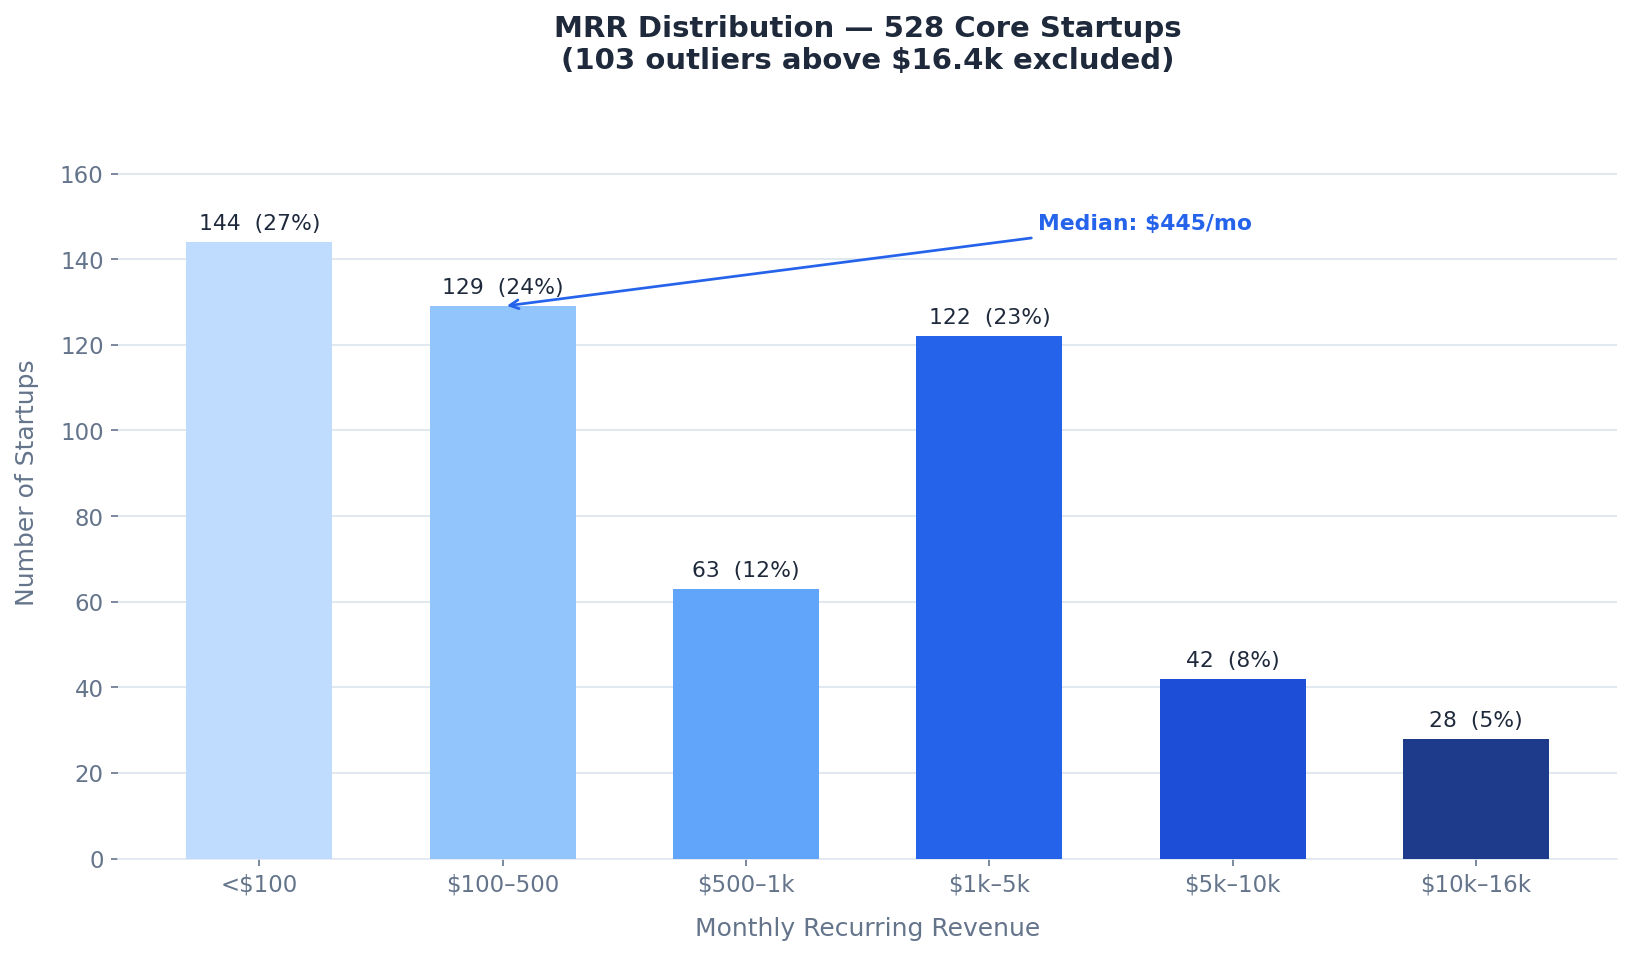
For the outliers, I used a standard statistical method (the IQR rule) to identify projects that sit far enough above the rest to be a genuinely different category of business. That threshold landed at roughly $16,400 MRR. Everything above it, 103 startups, I analyzed separately. Everything below, 528 projects with positive revenue, is the core dataset.
The median MRR in the core group is $445 per month.
About 27% of these projects make under $100 a month. Projects like Supaframe, a tool for embedding Supabase data into Notion, at $88 MRR, or JobBoardSearch, a job board aggregator, at $99. They exist. They have real users. They’re making almost nothing yet.
More than half of the core make under $500. Only 13% have crossed $5,000 MRR.
Marc Lou shared his own read of the TrustMRR data recently, and some of his stats look more optimistic: “81% made $1+, 44% made $1,000+, average time to first $1: 5 months.” These are live numbers from the platform, slightly different from my snapshot, but the order of magnitude is the same.


Now layer the three biases on top of this. The $445 median already looks low. But remember: it’s calculated on a dataset that skews toward stagnating projects (the for-sale ones), that excludes the true failures (who never joined), and that over-represents a community where transparency is a cultural value rather than a business outcome. The real distribution of all indie hacker projects ever attempted would look considerably more bottom-heavy than this.
That’s the reality check part.
But here’s where it gets genuinely interesting.
The Structure Is Actually Good
When I looked at profit margins, something shifted. Among the 464 startups that reported margin data, the median was 81%. The average was 78%. About 80% of them run at margins above 70%.
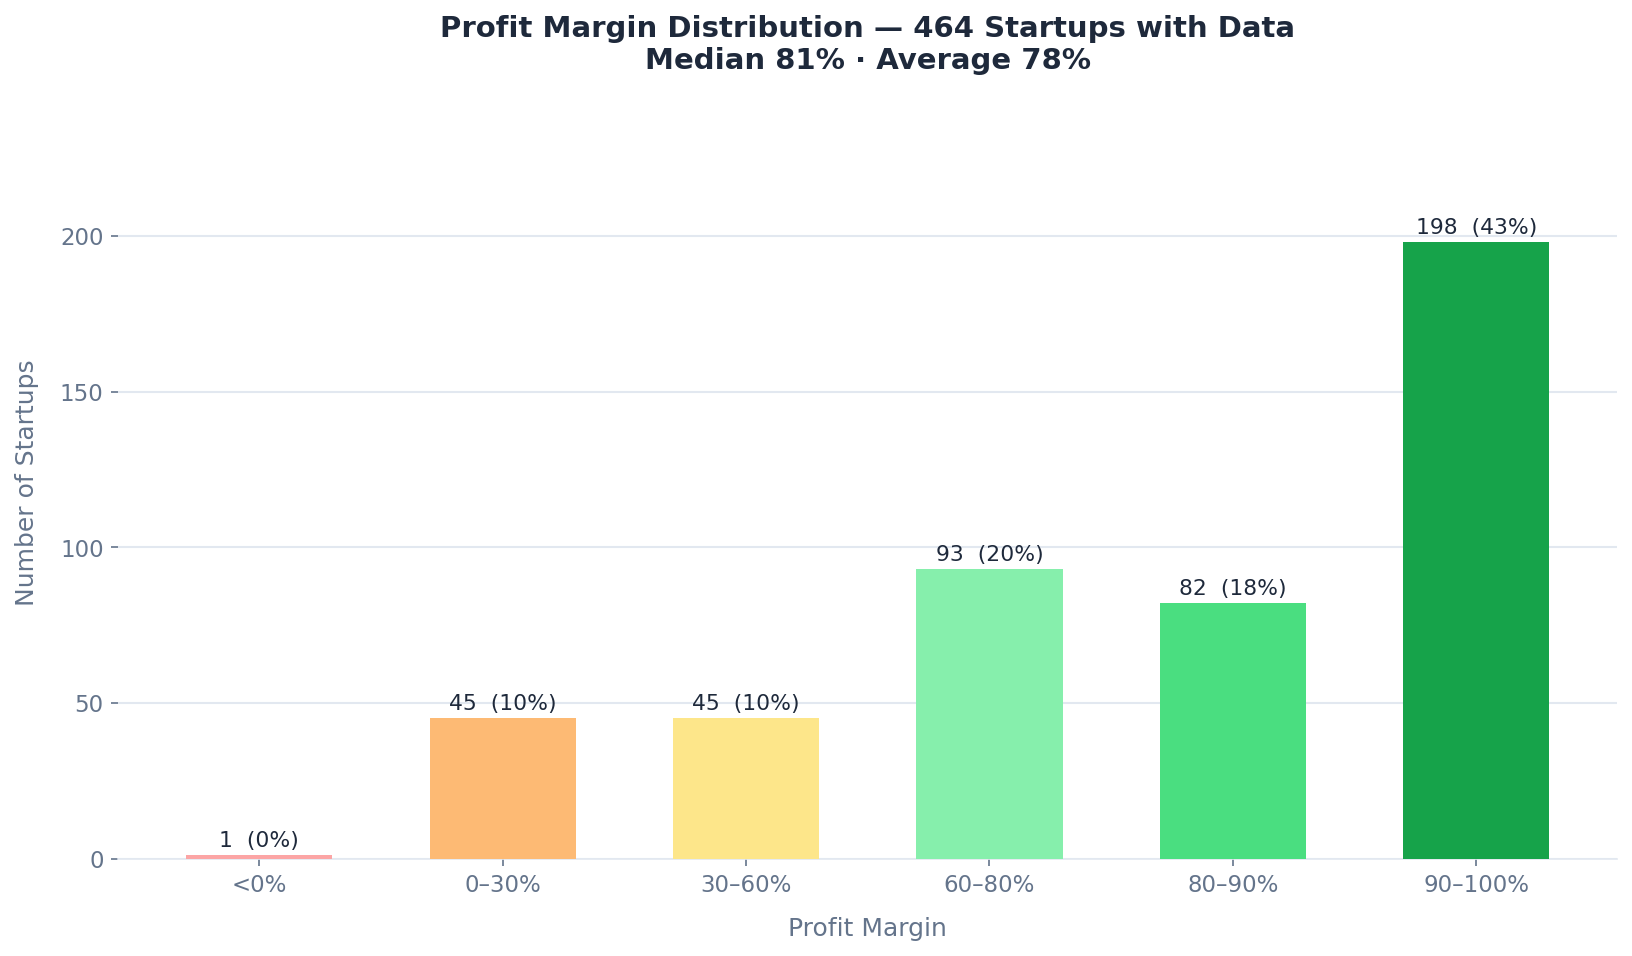
Think about that for a second. A traditional business (a restaurant, a service company, a retail shop) would celebrate 20% margins. These projects, even the ones making $445 a month, are keeping most of what they earn. The cost structure of a one-person software product is genuinely different from almost every other kind of business humans have built.
So yes, $445 median MRR sounds small. But $445 at 81% margins, with zero employees and a laptop you already own, is a very different animal than $445 in a traditional business.
And here’s the thing about the margins: they don’t drop much between the for-sale and not-for-sale groups. The plateau-ers have a median margin of 85%. The growing projects: 80%. The economics of the business model are sound at almost every level. What varies is growth, not structure.
The failure mode for most of these projects isn’t bankruptcy or debt. It’s “I made $445 a month for a while and then stopped.” That’s a strange kind of risk to be afraid of.
The Ladder Effect
Here’s what I think is the most underappreciated insight in the data. Look at the distribution again.
About 51% of the core projects are under $500 MRR. But once you zoom into the $1,000 to $5,000 band, something shifts. There are 122 startups there, a real cluster.
Projects like Guidejar, which helps teams create interactive product walkthroughs, at $4,874 MRR. Or TranslateMom at $4,788. Then 42 more between $5,000 and $10,000, like Prymatica at $9,926 or AgentGPT at $9,827. And 28 more between $10,000 and $16,000.
The taper is gradual. It’s not a cliff at $1,000 where almost everyone falls off. It looks more like a ramp, with meaningful numbers at each level.
And remember the bias: the not-for-sale projects in this range have a 651% average 30-day growth rate. The ones you don’t hear about, the ones whose founders are heads-down building rather than listing for acquisition, are growing fast. The ladder effect is real, and it’s probably more pronounced than the data suggests, because the rockets aren’t on the marketplace.
The hard part isn’t climbing from $5,000 to $10,000. The hard part is getting to $1,000 in the first place. The projects that make it there tend to keep moving.
There’s something worth sitting with here. If you’re at $200 MRR, you’re not halfway there. You’re still in the hardest part of the climb. That’s not a reason to stop. It’s a reason to not mistake early traction for momentum.
The Outlier Tier
Now the 103 startups I set aside. Their median MRR is $37,000. Their average is $102,000.
At the top: Stan at $3.5M MRR, a creator monetization platform. Then Rezi, an AI resume builder at $287,000 MRR. Cometly, an ad analytics platform, at $234,000. And Editee.com, an AI image editing tool from the Czech Republic, at $169,000.
These aren’t really indie hacker projects anymore, at least not in the sense most people mean. They’re real businesses that happen to have started with a single founder. Marc himself noted the milestone when TrustMRR crossed “$1B of startup revenue now verified”… impressive, but worth remembering that the top handful of projects account for a disproportionate share of that number.

What’s interesting is that even in this outlier group, the categories are familiar: software, AI tools, content creation, analytics. The difference isn’t that they found some exotic niche nobody had thought of. They built something in a crowded space and found distribution that compounded. PROSP, a French B2B prospecting tool at $128,000 MRR, is a good example: a familiar category, executed well, with a clear audience.
US dominance is much stronger in the outlier tier. Most of the top 15 named outliers are American, regardless of the France bias in the overall database. The really large outcomes are still largely American. That gap hasn’t closed yet.
What the “For Sale” Numbers Are Actually Telling You
Let me come back to the 38% of core projects listed for sale, because I think there’s more signal here than just a marketplace stat.
The median asking price in the core group is $30,250. For a project at $500 to $2,000 MRR, that’s a reasonable outcome for something that might have taken three months to build. The math often works. But the reason these projects are for sale matters.
The data shows that for-sale projects have higher median MRR ($727) than the not-for-sale ones ($319), but dramatically lower growth (119% vs 651%). These are plateau projects. The founder built something, got it to a certain level, and then either hit a ceiling or simply got bored and wanted to move on.
There’s nothing wrong with that. Building something small, selling it, and reinvesting the capital and learnings into the next project is a legitimate arc. I know something about that personally. But it does mean you should read the overall database numbers knowing that a significant portion of what you’re looking at is “projects whose founders have decided they’ve done what they can with them.”
The healthy, growing, exciting projects are mostly somewhere else — heads-down building, not listed for sale.
What I Take From This
The honest read of TrustMRR is that it shows you a particular slice of indie hacking: projects that are public, somewhat connected to Marc Lou’s community, and either early-stage or past their growth peak. It’s a useful slice, but it’s not the whole picture.
Within that slice, two things stand out.
First, the median is lower than most people think, and probably lower than even TrustMRR’s own numbers suggest, once you account for the biases. $445 is the median of a self-selected, transparency-oriented, partially plateau-ed group. The true median of all indie hacker attempts ever made would be much closer to zero.
Second, and this is what I find genuinely encouraging, the business structure is remarkably good. Median margins of 81%. Low overhead. No inventory. Global distribution from day one. Even the stagnating projects keep most of what they earn. That’s not the case in almost any other category of small business.
Marc Lou told the story of living in a centipede-infested apartment in Osaka in 2018, paying rent with acting gigs, feeding himself with cup ramen after two years of building and making $0.

He’s now making $94,000+ per month across his portfolio, with TrustMRR itself generating $31,000 in January 2026 alone. That arc is real. It’s also not the median. It’s the outlier who built the platform the rest of us are analyzing.
But here’s what I think the data is actually saying, if you read it charitably and honestly: most people who try this will struggle, but the ones who find something that works end up with a business structure that’s better than almost anything else available to an individual without capital. And the projects that make it to $1,000 MRR, past the hardest part of the climb, tend to keep moving.
Most of the projects in this dataset are less than two years old. A lot of them haven’t had time to compound yet. The for-sale ones have plateaued. The not-for-sale ones are growing at 651% per month on average.
The rockets aren’t on the marketplace. They’re still being built.